Challenges of Bringing the Business Intelligence Tiers Together

The four core business intelligence(BI) components: Data Feeds , Extract-Transform-Load Process , Data Warehouse and Presentation Layer come together and form a complete BI solution. Each tier plays an important role in keeping the system current and running. As you can probably guess, implementing and maintaining a system like this is not easy and is fairly complex.
Very simple errors in the first tiers could have a ripple effect into the entire system, making pieces of the implementation meaningless. Developing on an existing piece of BI software is not trivial. The BI system has a total of four complex tiers that need to communicate with each other effectively. Adding a business requirement to add another piece of data changes the logic in all four tiers of the implementation. Figure below shows the four different tiers that make up the full BI implementation.

Click on image to enlarge  

The BI Presentation Layer (Presentation of Knowledge)

The presentation layer is a logical tier in the architecture where business intelligence client software is used by the business users. The responsibility of these visual tools is to surface the data cleanly from a data warehouse or data mart to the user. This tier is sometimes referred to as the presentation of knowledge, as it is responsible for presenting not just data but insight in an easy-to-consume format.

In a typical BI implementation, usually there isn’t just one type of presentation software used. BI client software includes specific tools for different audiences. For example, a company executive may be interested in a high-level overview of the business and prefer looking at the data in a highly visual format such as a dashboard or a report. Conversely, a financial analyst who is very familiar with the data might prefer the power of a spreadsheet-like format, forgoing some of the simplicity of charts and graphs. This is why most BI software implementations provide a mixed bag of tools that is tailored to not only specific tool functionality but the audience as well.

Presentation tools can take many different forms, including web, desktop, and mobile.
Furthermore, they can be homegrown, custom-developed pieces of software or third-party pieces of software that sit on top of data warehouse structures. For example, Microsoft Performance Point Server is a piece of software that exposes multidimensional data that is found in Analysis Services cubes.

The Data Warehouse

The data warehouse is a storage repository for data that is used in business intelligence(BI) software. The end result of the ETL process is a data repository that is highly optimized for analysis and querying. Data warehouses tend to hold a great deal of historical information and tend to have large storage requirements. Therefore, they are usually stored in enterprise database software (such as Microsoft SQL Server) that allows for optimal use of the server hardware.

The data warehouse can be the primary repository that communicates with BI tools in the
presentation layer or it can be used as a staging area for further data transformations. For example, from our data warehouse, we could create a set of Analysis Services cubes for multidimensional analysis or create secondary smaller data marts for reporting or querying.

Extract-Transform-Load Process

Now that we have isolated the data we want to expose in our BI system, we need a process to move it into our BI platform. This process can be implemented using a multitude of different methodologies. I will focus on a couple of them. The three data feeds make up our global source in this example. We need a process to transform the data and a destination for that transformed data.

The process of converting the data into something usable by BI software is called an extracttransform-load (ETL) process. The ETL process has a source and a destination. The data feeds are the source and the data warehouse (which I’ll talk about in detail in the next section) is the destination. The name itself gives away the three main components of an ETL process:

Extract: This refers to the action that performs the extraction of the raw data from
the data feed. For example, for a database, this could be a select statement on a
table. If the data source is an API, this could call a method that extracts all your
contractor names.

Transform: This refers to the action of transforming the data into the required layout in the data warehouse or data mart. This is where the heavy lifting of the ETL process takes place and is usually the part that takes the most time to complete. The data source is rarely in the format that we want for making BI operations easy. Therefore, it is advantageous to perform different types of transforms to prepare the structure of the data in such a way that it can be consumed inside a BI visualization without the need for these complex structural manipulations. Typically, the transform portion of ETL focuses on several main
tasks: vertical partitioning, horizontal partitioning, aggregations, and other less time-consuming tasks like sorting or splitting up tables.

Vertical partitioning refers to filtering the data sets and stripping off unwanted rows from the data. For example, if we had information in our data feed that spanned the years 1950 to 2010 and only the last decade were relevant, we could simply avoid processing the older years to the destination.

Horizontal partitioning is similar to vertical partitioning. However, horizontal partitioning strips off unwanted columns or attributes from the data. For example, if we had address information (city, state, and ZIP) for our consultants in the data feed and this was deemed not relevant to our BI solution, we could simply ignore those columns. The benefit would be that less space would be taken up in our data warehouse.

Aggregation is essentially taking related data for input and returning a single scalar result (e.g., if we wanted to sum up all the hours our consultants worked in a given time period).

Load: This refers to taking the output of the transformation step and placing it into the appropriate location in the data warehouse, which could be a database or an in-memory data structure. The transform step “massages” the data structure so that it will easily fit into the destination tables.

http://www.blogger.com/post-edit.g?blogID=889889319149004544&postID=5137629408542511137Click on image to enlarge
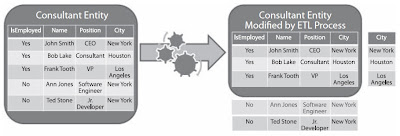
Figure above: Note that the example consultant entity is being horizontally partitioned (by removing the No rows from the IsEmployed column) and vertically partitioned (by removing the City column) before being transferred into the BI data warehouse.

There are many enterprise ETL tools on the market such as SQL Server Integration Services (which is included in SQL Server 2005 and 2008) that provide a visual way of designing, debugging, deploying, and managing data management processes.

Data Feeds

A business intelligence(BI) system is nothing without a valid data source. When designing a BI system, we first need to determine what data we want to consume for analysis. Most organizations have various information systems that aid them in their day-to-day operations. Internal data from a system that aids in everyday operations of an organization is usually a good candidate for a BI project. Data can also come from external or even public data sources as well. These data sources that provide the information that drives a BI implementation are referred to as data feeds.

Data feed sources can be anything that provides the required data in a well-structured format. They can be exposed in a variety of formats, such as databases, XML files, CSV files, and even API (application programming interface) service calls. There is no one-size-fits-all format type for a data feed. For example, XML files are good sources for smaller data that doesn’t change much. However, data that changes rapidly and is large might be better sourced from a database.

In some cases, the BI architect might not have a choice when consuming external data. For example, if you want to consume public data from a web site that provides guidance on salary information, you may have to use that site’s API. A vendor that provides data as a service is unlikely to make available a backup of its entire database nightly; however, it is more likely to provide an external-facing API as a service.

Figure below shows three separate feeds going into our BI system. Two feeds are internal and are sourced via database repositories. In addition, we are consuming a web service API data feed on salary information for consultants. We don’t know how the data is getting there, but we have architecturally defined what data we want to consume.

Click on image to enlarge

Time entry and HR systems are highly transactional with multiple updates happening every minute. Using the underlying databases directly as the source for data is not a good idea. The data feed sources need to pull data that is transitionally accurate, and pulling them from a live system does not guarantee that. Furthermore, largescale data pulls can adversely affect the performance of the underlying system.
 
Most BI implementations use a snapshot or a backup of the data that happens at a given point in time. The snapshots can be in the form of synchronization that can give an almost real-time feed to the data; alternatively, snapshots of the data can be taken at monthly intervals. This allows the data feed to “bridge” itself from the operations and transactions of the system.


Copyright © 2011. BI Articles and Study Case - All Rights Reserved
Proudly powered by Blogger