Case Study: 5 Categories of BI Identified for McCormick

To represent Business Intelligence (BI) projects of McCormick, use the five categories of BI that identified for McCormick. In actual practice, there might well be more than five projects, but let’s use five that will suffice. There are several ways to go about creating the BI opportunity map, one of which is to have one person array the projects within the opportunity map quadrants as the starting point for discussions with knowledgeable business and IT leaders and managers. If this approach is used, the initial BI opportunity map for McCormick might look like below:

Click on image to enlarge
  • All projects were judged to have a very positive business impact owing to strong alignment with company strategies and core business processes. Manufacturing BI was considered to have relatively less business impact because supply chain costs are a much higher proportion of total finished goods costs than are manufacturing costs. Financial planning and control BI was felt to provide lagging indicators, whereas product development BI, SCM BI, and customer service BI were judged to have more direct impacts on McCormick’s ability to execute its business strategies and value disciplines.
  • The projects were judged to have different risk characteristics based on the relative technical difficulty of acquiring and integrating the data needed to delivery the information from the source systems that contain the data, the availability and quality of the underlying data needed to deliver the information, and a number of organizational readiness factors.

Business and IT leaders and managers can use the initial BI opportunity map as the starting point for discussions addressing the underlying assumptions of the initial project placements, and then they can potentially adjust those placements, as illustrated as below: 

Click on image to enlarge
In the example above, the discussion of risk-reward tradeoffs resulted in a group consensus that:

  • Manufacturing BI had greater business impact and greater risk than originally perceived, as indicated by the manufacturing BI box.
  • SCM BI had greater business impact and less risk than originally perceived, as indicated by the SCM BI box.

Based on these discussions and the relative placement of the projects within the BI opportunity map, McCormick might then prioritize its BI opportunities as follows:
  1. SCM BI
  2. Product development BI
  3. Customer service BI
  4. Financial planning and control BI
  5. Manufacturing BI
These priorities would then establish the order in which the specific BI development projects would be undertaken.
The Need to Make Better Decisions

If only one term had to be used to describe the competitive business environment, it would be cutthroat. No matter what kind of industry or its size, every company is constantly trying hard to get a competitive advantage over its competitor. This is always happened in any small or big scale companies to one-up each other. One way an organization can attain an edge over its competition is by making decisions that have an increased positive impact and reduced risk to attain their goals.

Making the proper decision on any difficult task to selecting the best among alternatives can be hard. This is amplified in business when any decision could lead to a great success or a massive failure. Not having nor being able to understand a key piece of information could easily affect the case for selecting one decision path. Not too long ago, tough business decisions were made by long-time industry experts who had intimate knowledge of the business. These decisions were largely made on past historical or financial situations and rarely took into account data models. This led to high levels of failure, and some successful decisions could be attributed more to luck than effective decision-making techniques.

Processes for making decisions started to involve computers in the ’60s and ’70s. As the computer revolution started making its way from academia and government projects to mainstream businesses, people started leveraging computers to do continuous number crunching. Computers could process more data, and this eliminated some of the human error factors involved with complex statistics. This is where computers have an empirical advantage over humans, as they are tailored for mathematical computations and can be harnessed to run almost 24 hours per day. However, even enterprise-level computers in those days were not even close to the power of what we are used to today. Most of them couldn’t do much more than today’s programmable scientific calculator. The early horsepower of computer systems had to be specifically tailored for basic mathematical computations on data, as anything complex as artificial intelligence (AI) was completely out of the question.

Organizations quickly saw the benefit of having computer systems aid them in their everyday business processes. Even though the early computers weren’t that powerful, they could be used to garner vast amounts of data and perform complex business algorithms on it. The resultant data could then be used in the boardroom to shape corporate strategies via actionable decisions from executive information systems (EISs), group decision support systems (GDSSs), organizational decision support systems (ODSSs), and so on.

Decision Support Systems

The need for company executives to make better decisions and the rapid evolution of computing power led to the birth of decision support systems (DSSs). A DSS is a type of computer information system whose purpose is to support decision making processes. A well-designed DSS is an interactive software system that helps decision makers aggregate useful information from raw data, documents, and business models to solve problems and make decisions.

While these systems were first implemented in executive circles, they have quickly grown to be used by trained professionals as well. Various remnants of DSS software implementations can be found everywhere from the Internet to your local bank branch. For example, when you go to a bank and apply for a loan, complex DSS software is used to determine the risk to the bank based on your financial history. The result of this information will aid the loan officer as to whether the bank should make the decision to loan you money.

DSSs gained tremendous popularity in the late ’80s and early ’90s. The first systems that were deployed targeted large-scale organizations that needed help with large amounts of data which included the government, and the automobile and health care industries. These systems were very successful and delivered tremendous return on investment.

Early DSS projects, while largely successful, did have some challenges however:
  • Customizability: DSS software did not exist in the way it does today. A vendor couldn’t simply download a tool or customize a preexisting system. Usually, these tools had to be designed and programmed from scratch.
  • Multiple vendors: Implementations of early DSSs were a mix of software, hardware, servers, networking, and back-end services. In the ’80s and early ’90s, there wasn’t a single company that could provide all of the necessary components of complex systems at once. Multiple vendors usually worked on a single project together on a single DSS implementation.
  • Uniqueness: Early DSS software was unique and often the first of its kind. This usually meant that a great deal of planning had to be done to get concepts moved from theory into a working information system. Architects and programmers in the early days of DSS couldn’t rely on how-to guides to implement a unique custom system.
  • Long deployments: Projects that included custom software and hardware from multiple vendors obviously led to implementations that took a long time to complete.
  • Expensiveness: DSS systems in the ’80s and ’90s were very expensive and easily carried budgets of tens of millions of dollars.
DSSs allowed for entire organizations to function more effectively, as the underlying software powering those organizations provided insights from large amounts of data. This aided human decision makers to apply data models into their own decision making processes.

DSS software at its start was considered a luxury, as only the largest of organizations could afford its power. Since the software was custom and worked with the cooperation of multiple vendors, it was hard to apply these systems as reusable and resalable deployments. Tens of thousands of hours were invested in making these systems come to life. In the process of designing these complex systems, many innovations and great strides were made in the young software industry. These innovations were screaming to be let out into the wild and used in conjunction with other pieces of software.

The demand for DSS software was ripe and the vendors were beginning to taste the huge amounts of potential profits. If only they could make the software a little more generic and resalable, they could start selling smaller DSS implementations to a much larger audience. This idea led to applying the core innovations of complex DSS software into many smaller principles like data mining, data aggregation, enterprise reporting, and dimensional analysis. Enterprise software vendors started delivering pieces of DSS as separate application packages, and the early seeds of BI were sown.


Case Study: McCormick Driven Business Intelligence Value Creation Opportunities

Based on McCormick’s industry environment, business drivers, strategies, goals, and business design, the following Business Intelligence (BI) opportunities can be idenitified. Each would help McCormick improve profit and performance.  

  • Product development BI. Examples include sales trends by consumer end product categories such as beverages and baked goods, sales trends by McCormick customer and by McCormick ingredient product, and gross margin and volume trends for McCormick products. 
  • Customer service BI. Examples include customer profitability trends by customer and by consumer end-product category, such as dairy products and baked goods, and customer-specific order history, including order line volumes, frequency of orders, frequency of order changes, and order fulfillment metrics. 
  • SCM BI. Examples include demand history by McCormick product and by customer, supplier scorecards for McCormick suppliers, inventory levels by McCormick product and by customer, and performance metrics such as order-tocash cycle time, order-to-ship cycle time, and percentage of perfect orders. 
  • Manufacturing BI. Examples include batch yield history by McCormick product and plant, batch cost history by McCormick product and plant, quality trends by McCormick product and plant, and batch setup and changeover time trends by McCormick product and plant. 
  • Financial planning and control BI. Examples include forecast versus actual order volume, prices, and mix by McCormick product and by customer; forecast versus actual revenues by McCormick region, product, customer, and salesperson; and forecast versus actual gross margin by McCormick product and plant.
By systematically working through the BI opportunity analysis framework, we have identified specific BI opportunities for McCormick. By investing in one or more of these BI opportunities, McCormick would have better business information and analytical tools to inform key business decisions that drive increased profits. For example, industry consolidation puts pressure on profit margins. 

McCormick has chosen to respond to this challenge by adopting a strategy of supply chain collaboration, which seeks to drive costs down by using IT and business process improvements to improve operational efficiency. Toward that end, having SCM BI and customer service BI would allow McCormick manage the key variables and processes that determine supply chain costs, time, asset utilization, service, and quality—all of which contribute to the ability to maintain or improve gross margins in the face of margin pressures.

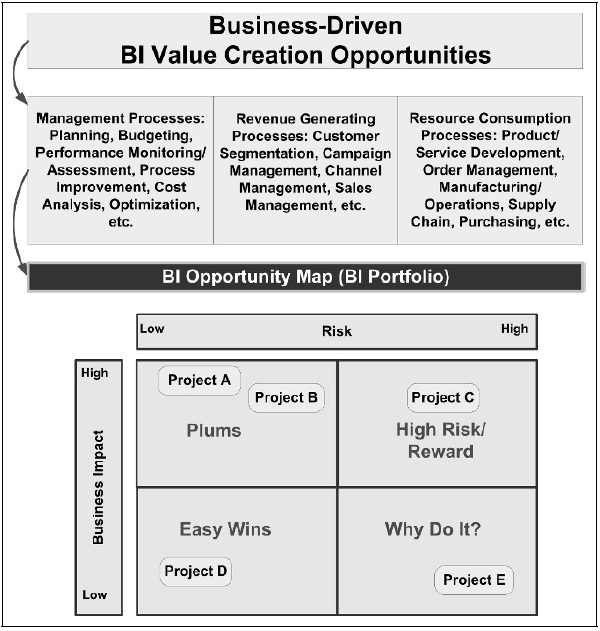
The McCormick BI opportunity analysis case study illustrates how your company could go about identifying actionable BI opportunities. The process does not stop there, however, as you then need to prioritize those opportunities based on business impact, risk, and project interdependencies. The next part of this BI opportunity analysis overview describes a straightforward method for prioritizing your BI opportunities.

Click on image to enlarge

Figure above shows the continuation of the BI opportunity analysis from the point of having identified opportunities of business-driven BI value creation to the point of having used a portfolio of BI opportunities to create a BI opportunity map. The BI opportunity map is a conceptual framework aimed at prioritizing BI opportunities based on what amounts to a risk-reward tradeoff. 

The opportunity map should not be thought of as a deterministic model, although opportunities are present to use multi-factor quantitative and/or qualitative analyses to support project placement on the business impact scale and/or the risk scale. Rather, the BI opportunity map serves as a basis for riskreward tradeoff discussions between the business and IT leaders and managers who collectively have to sponsor, execute, and leverage the contemplated BI investments so that business value is created. To illustrate the use of the BI opportunity map, let’s continue the analysis of the McCormick case.

What Does Business Analytics Mean?

It’s quite easy to imagine a bank that runs all its customer processes and dialogue programs entirely without using IT—and what really hard work that would be. The point here is, of course, that you can have business analytics(BA) without deploying software and IT solutions. At a basic level, that has been done for centuries, but today, it just wouldn’t stack up. In this book, we look at BA as information systems, consisting of three
elements:
  1. The information systems contain a technological element, which will typically be IT-based, but which in principle could be anything from papyrus scrolls and yellow sticky notes to clever heads with good memories. A characteristic of the technological element is that it can be used to collect, store, and deliver information. In the real world, we’re almost always talking about electronic data, which can be collected merged, and stored for analysts or the so-called front-end systems who will deliver information to end-users. A front-end is the visual presentation of information and data to a user. This can be a sales report in HTML format or graphs in a spreadsheet. A front-end system is thus a whole system of visual presentations and data.
  2. Human competencies form part of the information systems, too. Someone must be able to retrieve data and deliver it as information in, for instance, a front-end system, and analysts must know how to generate knowledge targeted toward specific decision processes. Even more important, those who make the decisions, those who potentially should change their behavior based on the decision support, are people who must be able to grasp the decision support handed to them.
  3. Finally, the information systems must contain some specific business processes that make use of the information or the new knowledge. A business process could be how you optimize inventory or how you price your products. After all, if the organization is not going to make use of the created information, there’s no reason to invest in a data warehouse, a central storage facility that combines and optimizes the organization’s data for business use.
The considerable investment required to establish a data warehouse must render a positive return for the organization through improved organization-wide decision making. If this doesn’t happen, a data warehouse is nothing but a cost that should never have been incurred. An information system is therefore both a facility (for instance a data warehouse, which can store information) as well as competencies that can retrieve and place this information in the right procedural context.

When working with BA, it is therefore not enough to just have an IT technical perspective—that just means seeing the organization as nothing but a system technical landscape, where you add another layer. It is essential to look at the organization as a large number of processes. For instance, the primary process in a manufacturing company will
typically consist of purchasing raw materials and semi-manufactured products from suppliers, manufacturing the products, storing these and selling them on. In relation to this primary process there are a large number of secondary processes, such as repairing machinery, cleaning, employing and training staff, and so on.

Therefore, when working with BA, it is essential to be able to identify which business processes to support via the information system, as well as to identify how added value is achieved. Finally, it’s important to see the company as an accumulation of competencies, and provide the information system with an identification and training of staff, some of whom undertake the technical solution, and others who can bridge the technical and the business-driven side of the organization, with focus on business processes. In terms of added value, this can be achieved in two ways: by an improved deployment of the input resources of the existing process, which means that efficiency increases, or by giving the users of the process added value, which means that what comes out of the process will have increased user or customer satisfaction.

In other words, successful deployment of BA requires a certain level of abstraction. This is because it’s necessary to be able to see the organization as a system technical landscape, an accumulation of competencies as well as a number of processes and, finally, to be able to integrate these three perspectives into each other. To make it all harder, the information systems must be implemented into an organization that perceives itself as a number of departments with different tasks and decision competencies and that occasionally does not even perceive them as being members of the same value chain.
     
    Copyright © 2011. BI Articles and Study Case - All Rights Reserved
    Proudly powered by Blogger